

The conversation I keep having with teams shipping AI:
“It worked when I tested it.”
I hear a version of this 3 times a week from developers in my network.
And honestly… I get it.
The model answered the test prompt.
The benchmark score looked good.
The demo felt smooth.
Then production added 10,000 users, real tools, concurrency, latency, retries, and a bill nobody had modelled.
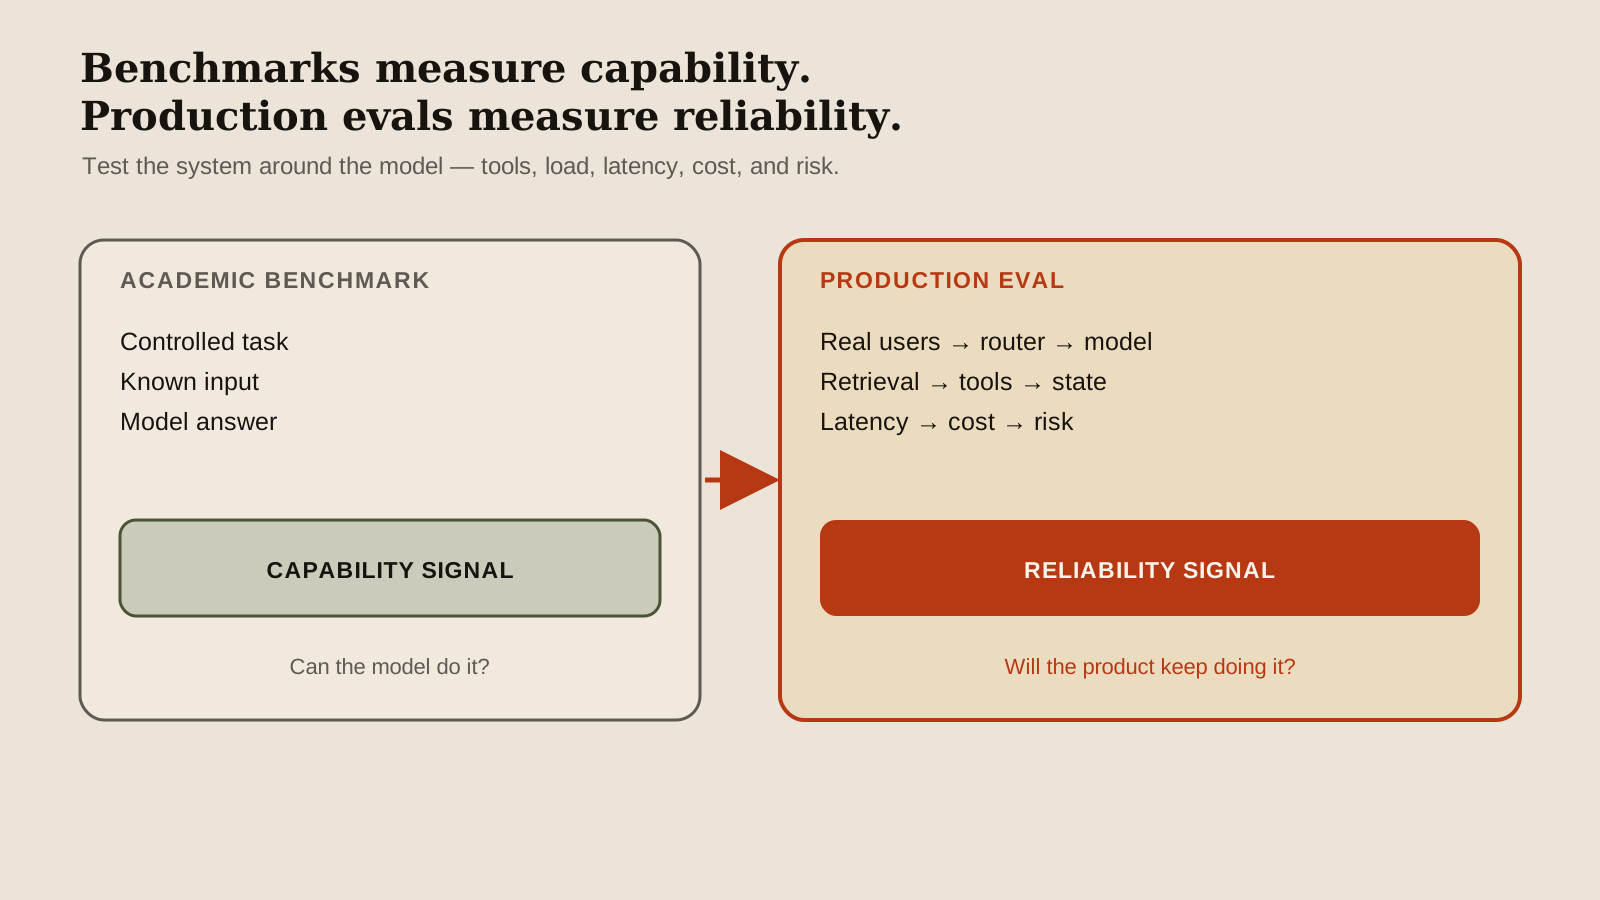
Academic benchmarks can tell you what a model can do.
They do not tell you whether the agent you built will survive contact with the system around it.
Benchmarks measure capability.
Production evals measure reliability.
The benchmark trap
A benchmark usually gives the model a controlled task and checks the answer.
Your product looks more like this:
User input
→ Router
→ Model
→ Retrieval
→ Tool call
→ Database or API
→ State update
→ User-facing result
Every arrow can change the outcome.
The final answer can be correct while the tool parameters are wrong.
The tool can succeed while the result is misinterpreted.
The average latency can look fine while P99 users wait through a timeout.
The token cost can look low while retries make each successful task expensive.
A passing model is not a passing product.
What should you evaluate?
The system you actually built — with its real tools, real data, real users, and real failure paths.
10 metrics that actually matter
1. Accuracy
Start with the obvious question:
Did the system produce the correct result?
Necessary.
Insufficient.
Accuracy needs a task-specific pass condition.
“The answer sounded right” is not a pass condition for a payment, a customer record, or a deployment.
Define the expected outcome at the business boundary:
- Exact match — did it return the right value?
- Partial credit — which fields or steps were correct?
- Outcome — did the user’s task actually finish?
- Severity — is this a harmless wording issue or a destructive action?
One overall accuracy number hides the failures that cost you.
Track the score by workflow, input type, model route, and consequence.
2. Faithfulness
Can important claims be traced back to evidence?
Fluent is not grounded.
An agent can produce a beautifully written answer that cites the wrong document, invents a policy, or quietly combines 2 unrelated records.
For retrieval and summarization tasks, evaluate:
- Evidence selection — did it retrieve the right source?
- Claim support — does each important claim follow from that source?
- Coverage — did it omit the evidence that would change the decision?
- Attribution — can a reviewer locate the supporting passage?

The test is not “did the response contain citations?”
The test is whether the citations support the claims that matter.
3. Tool-call success
Do not collapse tool performance into one green check.
Measure 4 separate stages:
- Tool selection — did the agent choose the right capability?
- Parameter accuracy — were the arguments valid and correctly scoped?
- Execution success — did the tool complete without an error or timeout?
- Result interpretation — did the agent understand what came back?
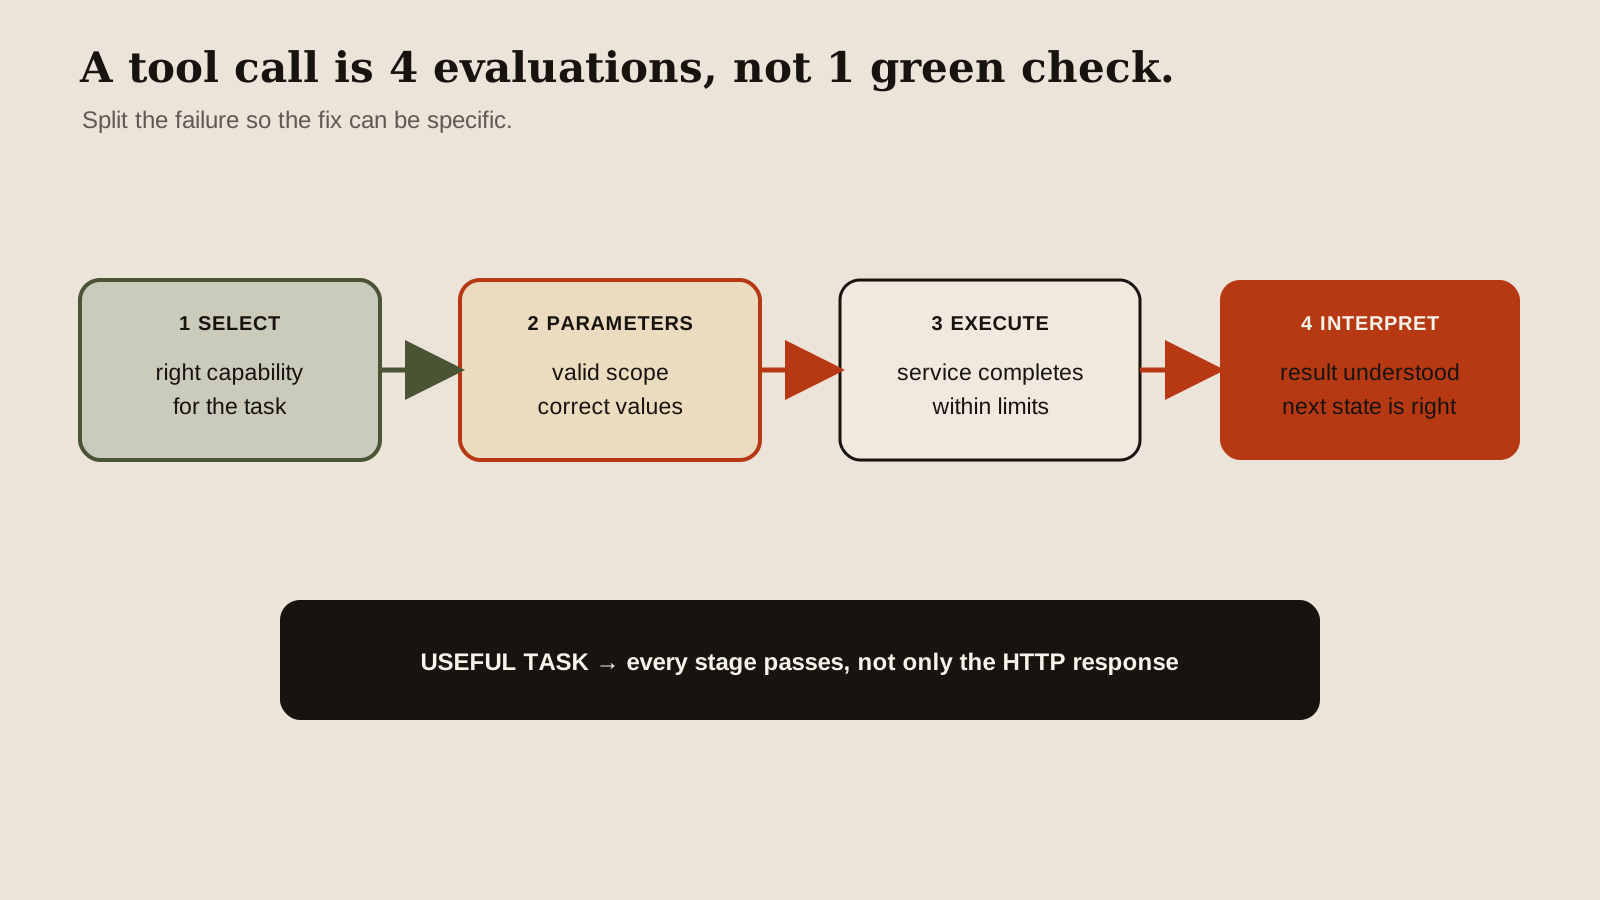
Each stage produces a different fix.
Wrong tool selection needs routing or descriptions.
Wrong parameters need schemas, validation, or better state.
Execution failures need service and retry work.
Wrong interpretation needs output contracts and evaluation cases.
“The tool returned 200” is not task success.
4. Tool calls under concurrency
The single-user test is the easiest possible environment.
Run the same evaluation at:
| Load | What it reveals |
|---|---|
| 1 user | Basic correctness and a clean dependency path |
| 100 users | Queue behaviour, rate limits, and connection pressure |
| 1,000 users | Pool exhaustion, state mixing, tail latency, and saturation |
Concurrency exposes bugs a benchmark cannot see.
Requests share queues.
Database pools fill.
Rate limits fire.
One user’s state can appear in another user’s result if the boundary is wrong.
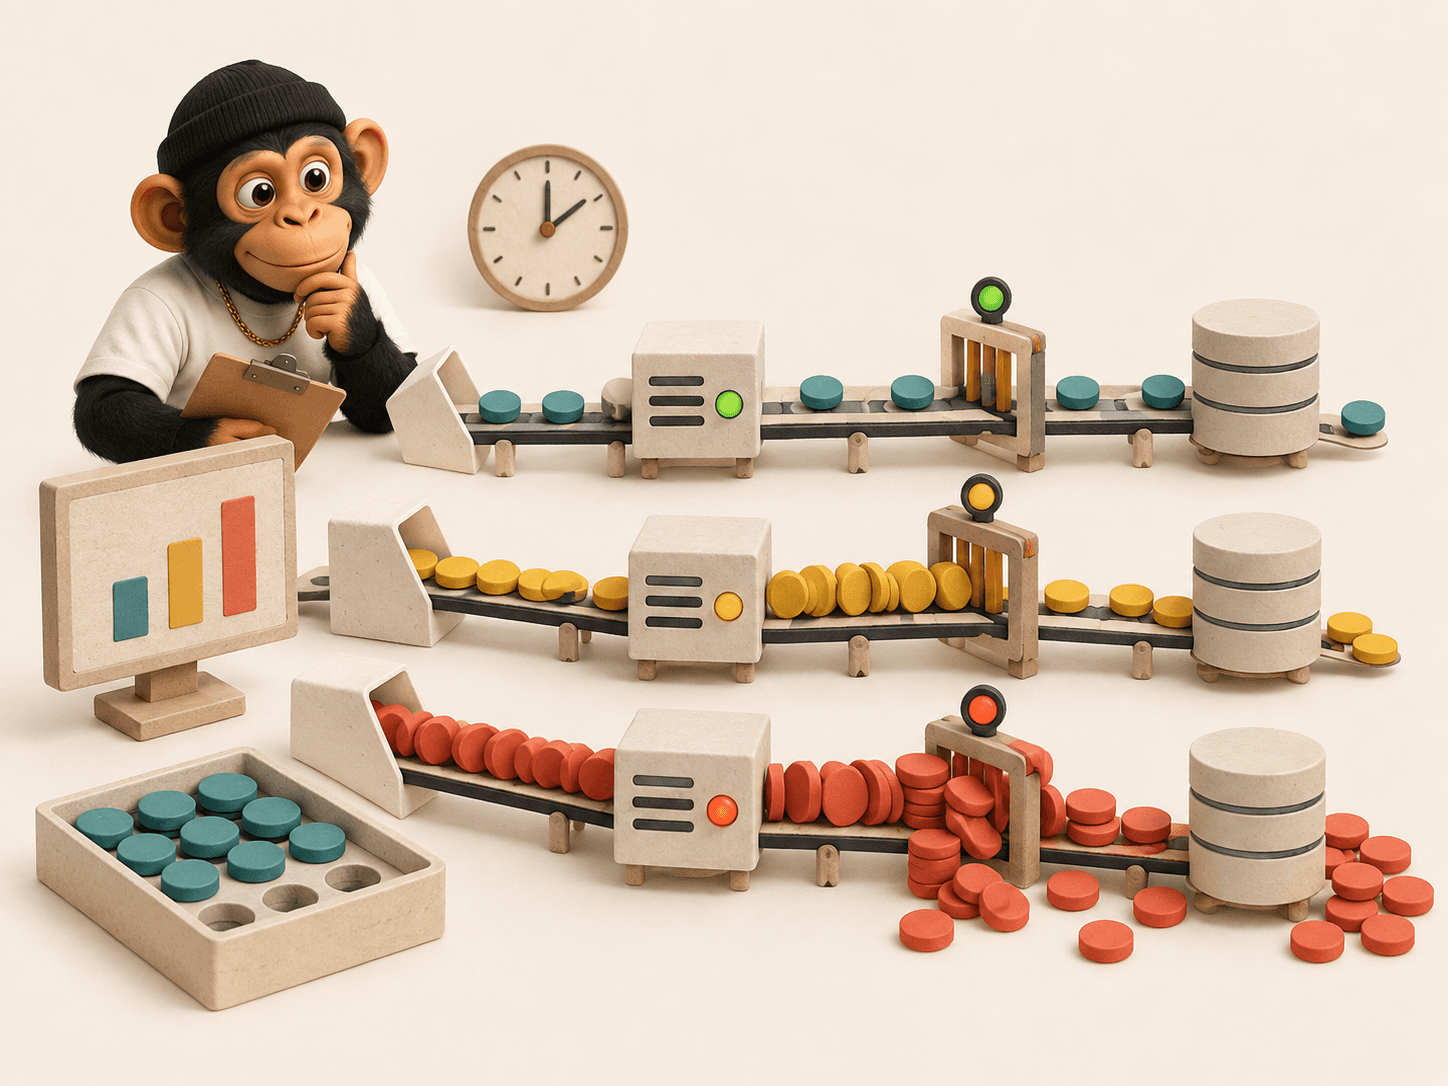
Do not report “tool success: 98%” without the load condition.
98% at 1 user and 72% at 1,000 users are 2 different products.
5. Latency under load
Track P50, P95, and P99 — not only averages.
The average tells you very little about the tail:
“What does the slowest 1% experience?”
Your worst user lives in the tail.
| Measure | Practical question |
|---|---|
| P50 | Is the normal path fast enough? |
| P95 | What does a slow but common request feel like? |
| P99 | What happens at the edge of the system’s capacity? |
Track latency for the full task and for each stage:
Route → model → retrieval → tool → database → responseA slow P99 retrieval layer can make the model look guilty.
A slow tool can make the whole agent look unreliable.
Position matters.
Measure the spans before changing the model.
6. Cost per successful task
Cost per token is a component metric.
The business metric is closer to:
Total evaluation cost
÷ successful useful tasks
= cost per successful task
Include the costs that disappear in a happy-path demo:
- Retries — how many extra calls did recovery require?
- Routing — did the task use the correct model tier?
- Tools — what did retrieval, APIs, queues, and database work cost?
- Human review — how much operator time did the task consume?
- Failure work — how many runs produced no useful outcome?
A cheap model with a high false-action rate is not cheap.
An expensive model that finishes the task correctly in 1 pass may be the better product choice.
Measure the dollar required to produce a useful outcome.
7. False-action rate
How often does the agent act when it should not?
This metric catches the most expensive category of confidence.
Examples:
- Write instead of read
- Send instead of draft
- Execute instead of ask
- Delete instead of archive
- Escalate data instead of requesting permission

Measure both sides:
False action = acted when policy required pause
Missed action = paused when safe automation was allowed
The first creates risk.
The second creates friction and operator overload.
Your target is not “the agent never acts.”
Your target is the agent acts only inside the authority it has earned.
8. Escalation accuracy
Does the system know when to route the task to a stronger model or a human?
Escalation is part of the answer.
It is not a failure state to hide from the dashboard.
Evaluate:
- True escalation — did a risky or uncertain task reach the right reviewer?
- Missed escalation — did the system continue when it should have stopped?
- False escalation — did an easy task create unnecessary human work?
- Recovery quality — did the handoff include enough context to continue?
The strongest model is not the right model for every task.
The reliable router knows when not to pretend.
9. Cache hit rate
Caching can reduce latency and spend.
That does not mean every cache is helping.
Measure:
- Hit rate — how many eligible requests reused a result?
- Latency saved — did the hit shorten the user-visible path?
- Spend avoided — did it remove model or tool work?
- Freshness — was the cached result still valid for this user and state?
A high hit rate for stale or wrongly scoped results is not a win.
Cache keys need the right identity, permissions, locale, model version, and data freshness boundary.
Sometimes moving the cache decision earlier fixes everything.
Sometimes it moves the bug earlier too.
10. Routing accuracy
Did the router send the task to the correct model or tier?
Routing errors show up as other failures:
- A simple task sent to a slow expensive model.
- An ambiguous task sent to a weak model.
- A tool-heavy task sent to a route without the right capability.
- A high-risk task sent past the required approval path.
Score routing as its own evaluation.
Input → expected route → actual route → task outcomeThe router is part of the product.
If it is wrong, the model may never get a fair chance to succeed.
The production eval scorecard
Here is the scorecard I want before calling an agent reliable:
| Metric | What to record |
|---|---|
| Accuracy | Correct result by workflow and severity |
| Faithfulness | Supported claims, evidence coverage, attribution |
| Tool selection | Right capability for the task |
| Parameter accuracy | Valid, scoped, correctly typed arguments |
| Tool success under load | Completion at 1, 100, and 1,000 users |
| P95/P99 latency | Full-task and per-stage tail latency |
| Cost per successful task | Total spend divided by useful outcomes |
| False-action rate | Actions taken outside policy or authority |
| Escalation accuracy | Correct stop, handoff, or stronger-model route |
| Routing accuracy | Actual model/tier versus expected route |
| Cache hit rate | Valid hits, latency saved, spend avoided |
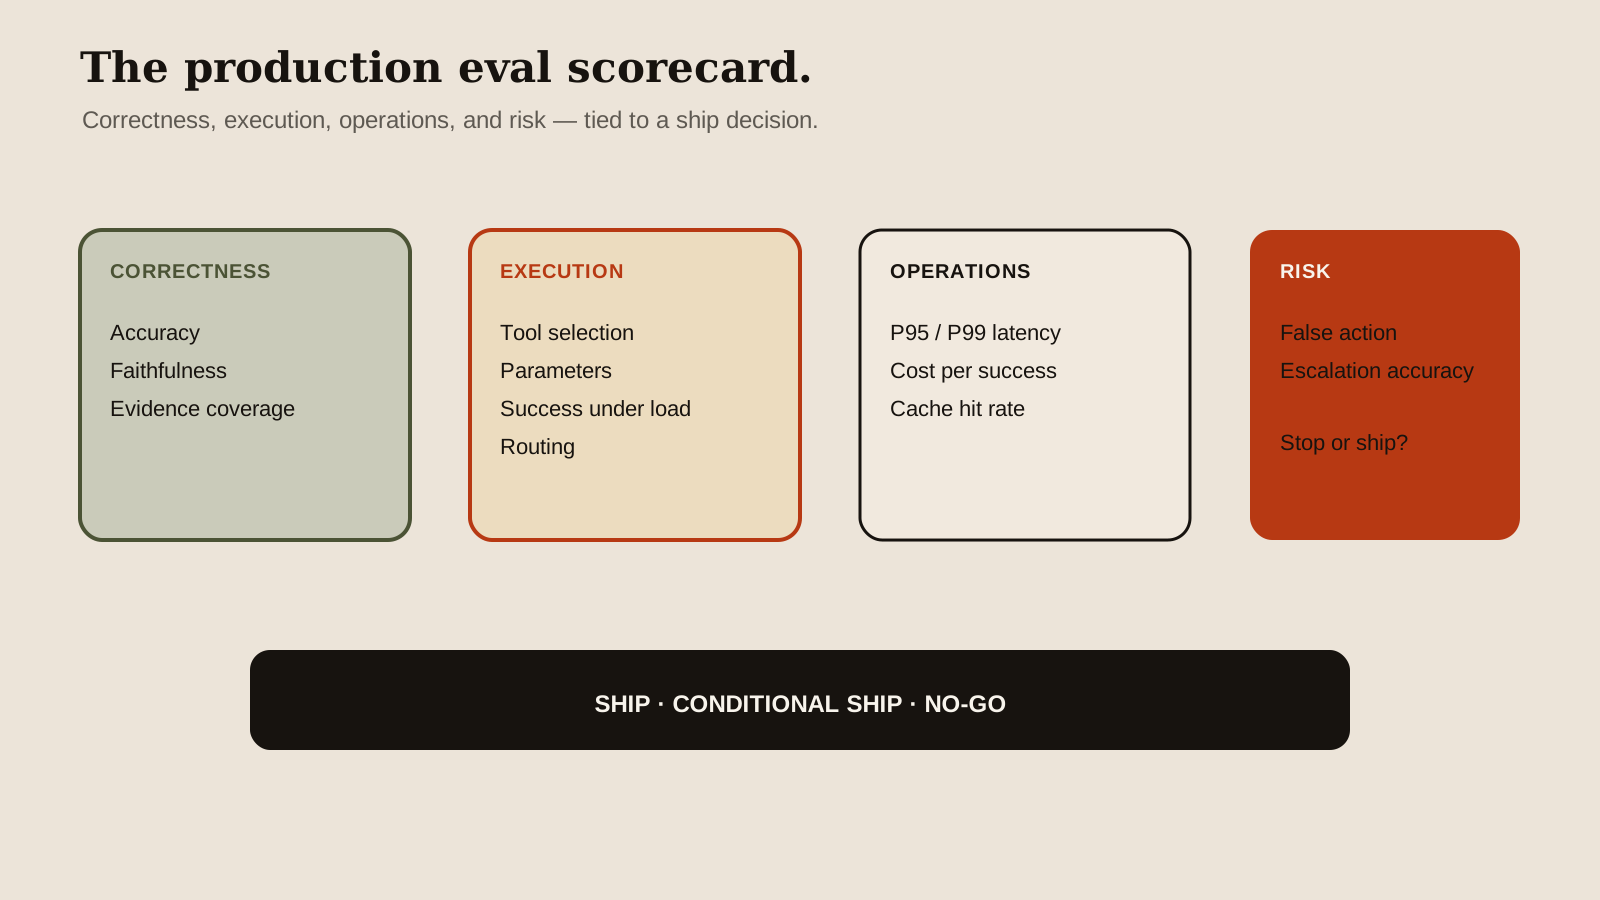
Do not turn this into a vanity dashboard with 11 green numbers.
Attach every metric to a decision:
- Ship — the task meets its reliability and risk threshold.
- Conditional ship — the workflow stays bounded while evidence grows.
- No-go — the failure mode is too costly or too invisible.
The scorecard is useful when it changes what you do next.
The real bottom line
Run the benchmark.
Then benchmark the system you actually built.
The metric that matters most is closer to:
Successful useful tasks
÷ dollars spent
at an acceptable risk level
That number only means something when you also know the P95/P99 latency, concurrency level, false-action rate, escalation behaviour, and evidence quality behind it.
The future is not a model leaderboard with your product bolted underneath.
It is a production eval loop that tells you what works, what breaks, and what to fix before real users become the QA team.
Building that loop around one workflow is the job of a fixed-price reliability sprint for one AI agent.
Your turn
Which metric is missing from your current AI dashboard?
Accuracy?
Tool-call success?
P99 latency?
Cost per successful task?
False actions?
Drop it below 👇
Let's compare the scorecards 😄